Chapter 2: Build a dashboard
The first part of this tutorial introduced you to most of Owl ideas. It is now time to learn about the Odoo JavaScript framework in its entirety, as used by the web client.

To get started, you need a running Odoo server and a development environment setup. Before getting
into the exercises, make sure you have followed all the steps described in this
tutorial introduction. For this chapter, we will start
from the empty dashboard provided by the awesome_dashboard addon. We will progressively add
features to it, using the Odoo JavaScript framework.
Goal
The solutions for each exercise of the chapter are hosted on the official Odoo tutorials repository.
1. A new Layout
Most screens in the Odoo web client uses a common layout: a control panel on top, with some buttons,
and a main content zone just below. This is done using the Layout component, available in @web/search/layout.
Update the
AwesomeDashboardcomponent located inawesome_dashboard/static/src/to use theLayoutcomponent. You can use{controlPanel: {} }for thedisplayprops of theLayoutcomponent.Add a
classNameprop toLayout:className="'o_dashboard h-100'"Add a
dashboard.scssfile in which you set the background-color of.o_dashboardto gray (or your favorite color)
Open http://localhost:8069/web, then open the Awesome Dashboard app, and see the result.
Theory: Services
In practice, every component (except the root component) may be destroyed at any time and replaced (or not) with another component. This means that each component internal state is not persistent. This is fine in many cases, but there certainly are situations where we want to keep some data around. For example, all Discuss messages should not be reloaded every time we display a channel.
Also, it may happen that we need to write some code that is not a component. Maybe something that process all barcodes, or that manages the user configuration (context, etc.).
The Odoo framework defines the idea of a service, which is a persistent piece of code that exports state and/or functions. Each service can depend on other services, and components can import a service.
The following example registers a simple service that displays a notification every 5 seconds:
import { registry } from "@web/core/registry";

const myService = {
    dependencies: ["notification"],
    start(env, { notification }) {
        let counter = 1;
        setInterval(() => {
            notification.add(`Tick Tock ${counter++}`);
        }, 5000);
    },
};

registry.category("services").add("myService", myService);
Services can be accessed by any component. Imagine that we have a service to maintain some shared state:
import { registry } from "@web/core/registry";

const sharedStateService = {
    start(env) {
        let state = {};
        return {
            getValue(key) {
                return state[key];
            },
            setValue(key, value) {
                state[key] = value;
            },
        };
    },
};

registry.category("services").add("shared_state", sharedStateService);
Then, any component can do this:
import { useService } from "@web/core/utils/hooks";

setup() {
   this.sharedState = useService("shared_state");
   const value = this.sharedState.getValue("somekey");
   // do something with value
}
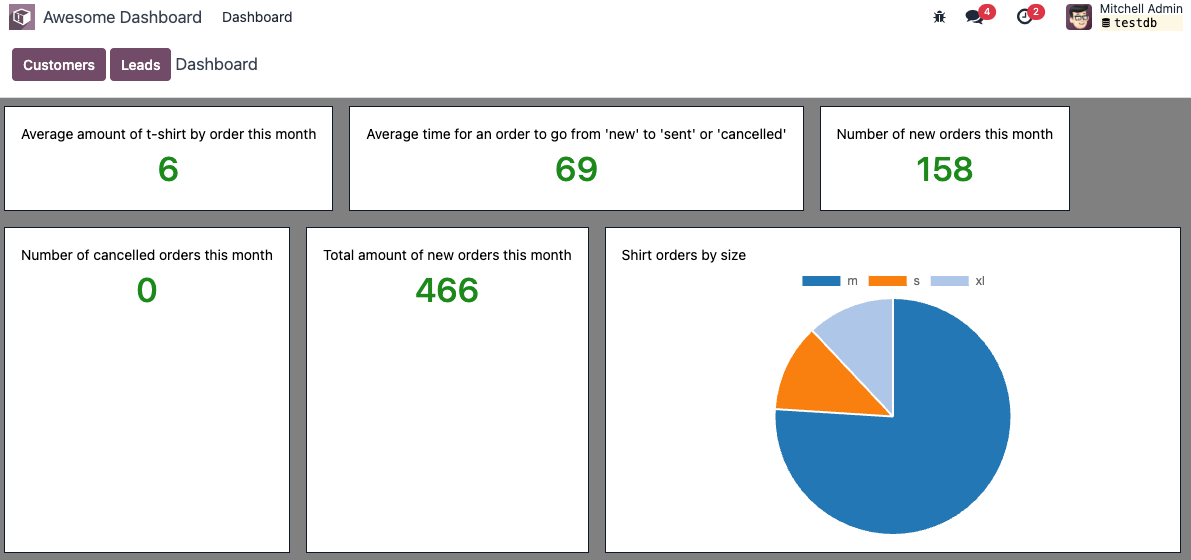
2. Add some buttons for quick navigation
One important service provided by Odoo is the action service: it can execute
all kind of standard actions defined by Odoo. For example, here is how one
component could execute an action by its xml id:
import { useService } from "@web/core/utils/hooks";
...
setup() {
      this.action = useService("action");
}
openSettings() {
      this.action.doAction("base_setup.action_general_configuration");
}
...
Let us now add two buttons to our control panel:
A button
Customers, which opens a kanban view with all customers (this action already exists, so you should use its xml id).A button
Leads, which opens a dynamic action on thecrm.leadmodel with a list and a form view. Follow the example of this use of the action service.

See also
3. Add a dashboard item
Let us now improve our content.
Create a generic
DashboardItemcomponent that display its default slot in a nice card layout. It should take an optionalsizenumber props, that default to1. The width should be hardcoded to(18*size)rem.Add two cards to the dashboard. One with no size, and the other with a size of 2.
See also
4. Call the server, add some statistics
Let’s improve the dashboard by adding a few dashboard items to display real business data.
The awesome_dashboard addon provides a /awesome_dashboard/statistics route that is meant
to return some interesting information.
To call a specific controller, we need to use the rpc function.
It only exports a single function that perform the request: rpc(route, params, settings).
A basic request could look like this:
import { rpc } from "@web/core/network/rpc";
// ...

setup() {
   onWillStart(async () => {
      const result = await rpc("/my/controller", {a: 1, b: 2});
   })
   // ...
}
Update
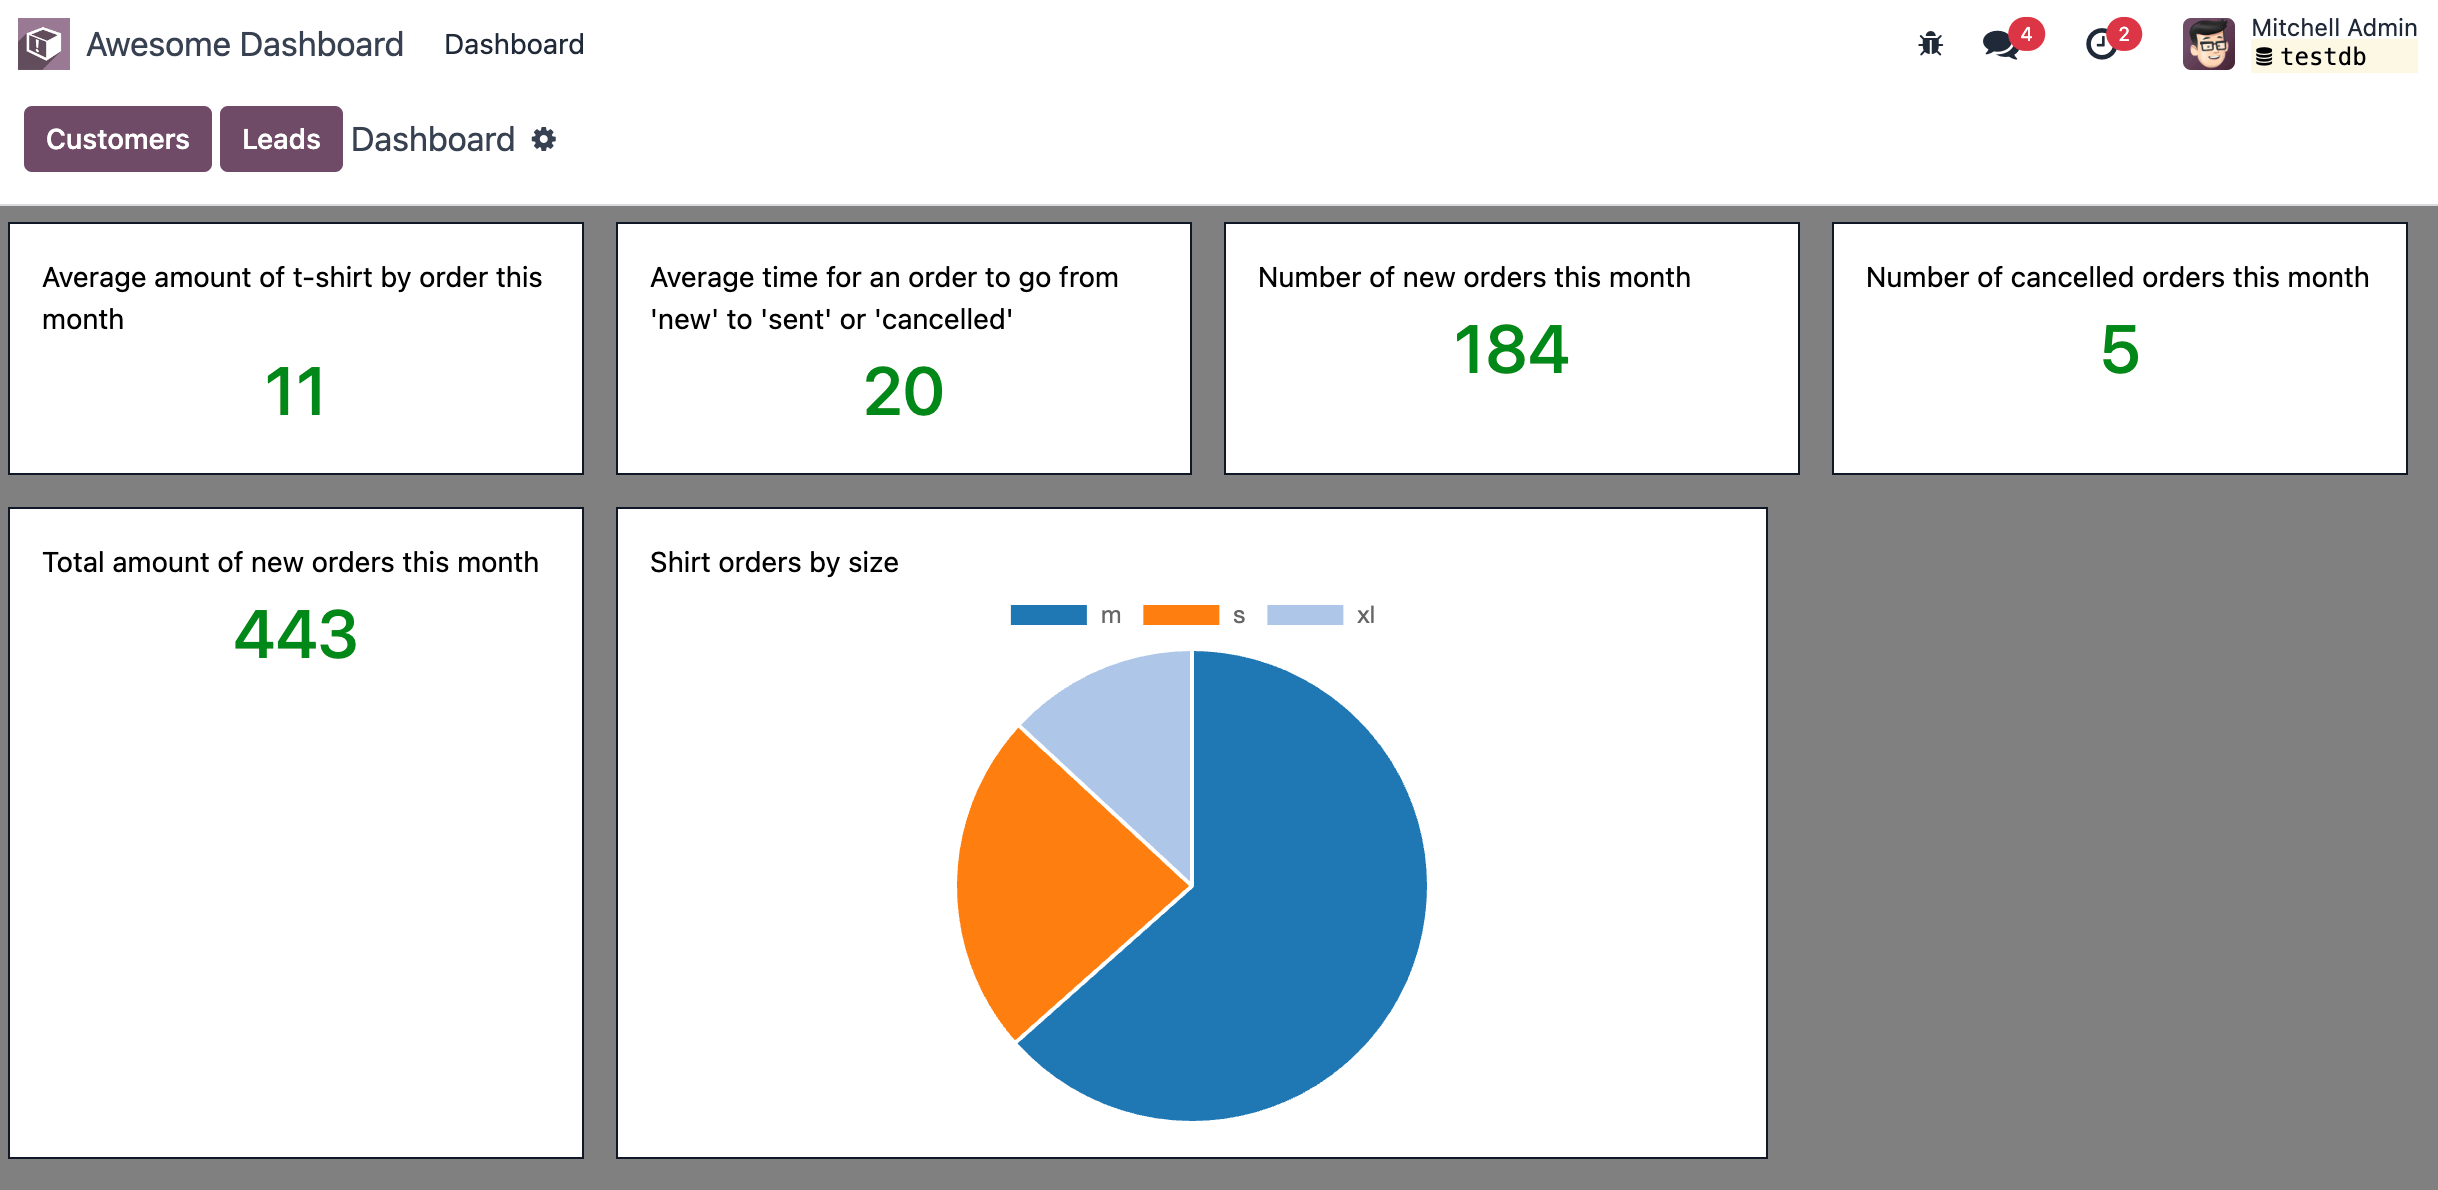
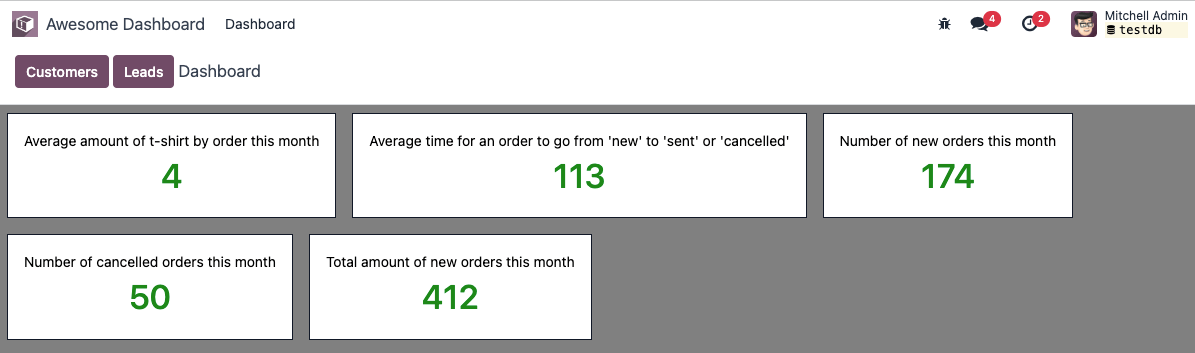
Dashboardso that it uses therpcfunction and call the statistics route/awesome_dashboard/statistics.Display a few cards in the dashboard containing:
Number of new orders this month
Total amount of new orders this month
Average amount of t-shirt by order this month
Number of cancelled orders this month
Average time for an order to go from ‘new’ to ‘sent’ or ‘cancelled’
See also
5. Cache network calls, create a service
If you open the Network tab of your browser’s dev tools, you will see that the call to
/awesome_dashboard/statistics is done every time the client action is displayed. This is because the
onWillStart hook is called each time the Dashboard component is mounted. But in this case, we
would prefer to do it only the first time, so we actually need to maintain some state outside of the
Dashboard component. This is a nice use case for a service!
Register and import a new
awesome_dashboard.statisticsservice.It should provide a function
loadStatisticsthat, once called, performs the actual rpc, and always return the same information.Use the memoize utility function from
@web/core/utils/functionsthat allows caching the statistics.Use this service in the
Dashboardcomponent.Check that it works as expected.
6. Display a pie chart
Everyone likes charts (!), so let us add a pie chart in our dashboard. It will display the proportions of t-shirts sold for each size: S/M/L/XL/XXL.
For this exercise, we will use Chart.js. It is the chart library used by the graph view. However, it is not loaded by default, so we will need to either add it to our assets bundle, or lazy load it. Lazy loading is usually better since our users will not have to load the chartjs code every time if they don’t need it.
Create a
PieChartcomponent.In its
onWillStartmethod, load chartjs, you can use the loadJs function to load/web/static/lib/Chart/Chart.js.Use the
PieChartcomponent in aDashboardItemto display a pie chart that shows the quantity for each sold t-shirts in each size (that information is available in the/statisticsroute). Note that you can use thesizeproperty to make it look larger.The
PieChartcomponent will need to render a canvas, and draw on it usingchart.js.Make it work!
7. Real life update
Since we moved the data loading in a cache, it never updates. But let us say that we are looking at fast moving data, so we want to periodically (for example, every 10min) reload fresh data.
This is quite simple to implement, with a setTimeout or setInterval in the statistics service.
However, here is the tricky part: if the dashboard is currently being displayed, it should be
updated immediately.
To do that, one can use a reactive object: it is just like the proxy returned by useState,
but not linked to any component. A component can then do a useState on it to subscribe to its
changes.
Update the statistics service to reload data every 10 minutes (to test it, use 10s instead!)
Modify it to return a reactive object. Reloading data should update the reactive object in place.
The
Dashboardcomponent can now use it with auseState
8. Lazy loading the dashboard
Let us imagine that our dashboard is getting quite big, and is only of interest to some of our users. In that case, it could make sense to lazy load our dashboard, and all related assets, so we only pay the cost of loading the code when we actually want to look at it.
One way to do this is to use LazyComponent (from @web/core/assets) as an intermediate
that will load an asset bundle before displaying our component.
Example
example_action.js:
export class ExampleComponentLoader extends Component {
    static components = { LazyComponent };
    static template = xml`
        <LazyComponent bundle="'example_module.example_assets'" Component="'ExampleComponent'" />
    `;
}

registry.category("actions").add("example_module.example_action", ExampleComponentLoader);
Move all dashboard assets into a sub folder
/dashboardto make it easier to add to a bundle.Create a
awesome_dashboard.dashboardassets bundle containing all content of the/dashboardfolder.Modify
dashboard.jsto register itself to thelazy_componentsregistry instead ofactions.In
src/dashboard_action.js, create an intermediate component that usesLazyComponentand register it to theactionsregistry.
9. Making our dashboard generic
So far, we have a nice working dashboard. But it is currently hardcoded in the dashboard template. What if we want to customize our dashboard? Maybe some users have different needs and want to see other data.
So, the next step is to make our dashboard generic: instead of hard-coding its content in the template, it can just iterate over a list of dashboard items. But then, many questions come up: how to represent a dashboard item, how to register it, what data should it receive, and so on. There are many different ways to design such a system, with different trade-offs.
For this tutorial, we will say that a dashboard item is an object with the following structure:
const item = {
   id: "average_quantity",
   description: "Average amount of t-shirt",
   Component: StandardItem,
   // size and props are optionals
   size: 3,
   props: (data) => ({
      title: "Average amount of t-shirt by order this month",
      value: data.average_quantity
   }),
};
The description value will be useful in a later exercise to show the name of items that the
user can add to their dashboard. The size number is optional, and simply describes
the size of the dashboard item that will be displayed. Finally, the props function is optional.
If not given, we will simply give the statistics object as data. But if it is defined, it will
be used to compute specific props for the component.
The goal is to replace the content of the dashboard with the following snippet:
<t t-foreach="items" t-as="item" t-key="item.id">
   <DashboardItem size="item.size || 1">
      <t t-set="itemProp" t-value="item.props ? item.props(statistics) : {'data': statistics}"/>
      <t t-component="item.Component" t-props="itemProp" />
   </DashboardItem>
</t>
Note that the above example features two advanced features of Owl: dynamic components and dynamic props.
We currently have two kinds of item components: number cards with a title and a number, and pie cards with some label and a pie chart.
Create and implement two components:
NumberCardandPieChartCard, with the corresponding props.Create a file
dashboard_items.jsin which you define and export a list of items, usingNumberCardandPieChartCardto recreate our current dashboard.Import that list of items in our
Dashboardcomponent, add it to the component, and update the template to use at-foreachlike shown above.setup() { this.items = items; }
And now, our dashboard template is generic!
10. Making our dashboard extensible
However, the content of our item list is still hardcoded. Let us fix that by using a registry:
Instead of exporting a list, register all dashboard items in a
awesome_dashboardregistryImport all the items of the
awesome_dashboardregistry in theDashboardcomponent
The dashboard is now easily extensible. Any other Odoo addon that wants to register a new item to the dashboard can just add it to the registry.
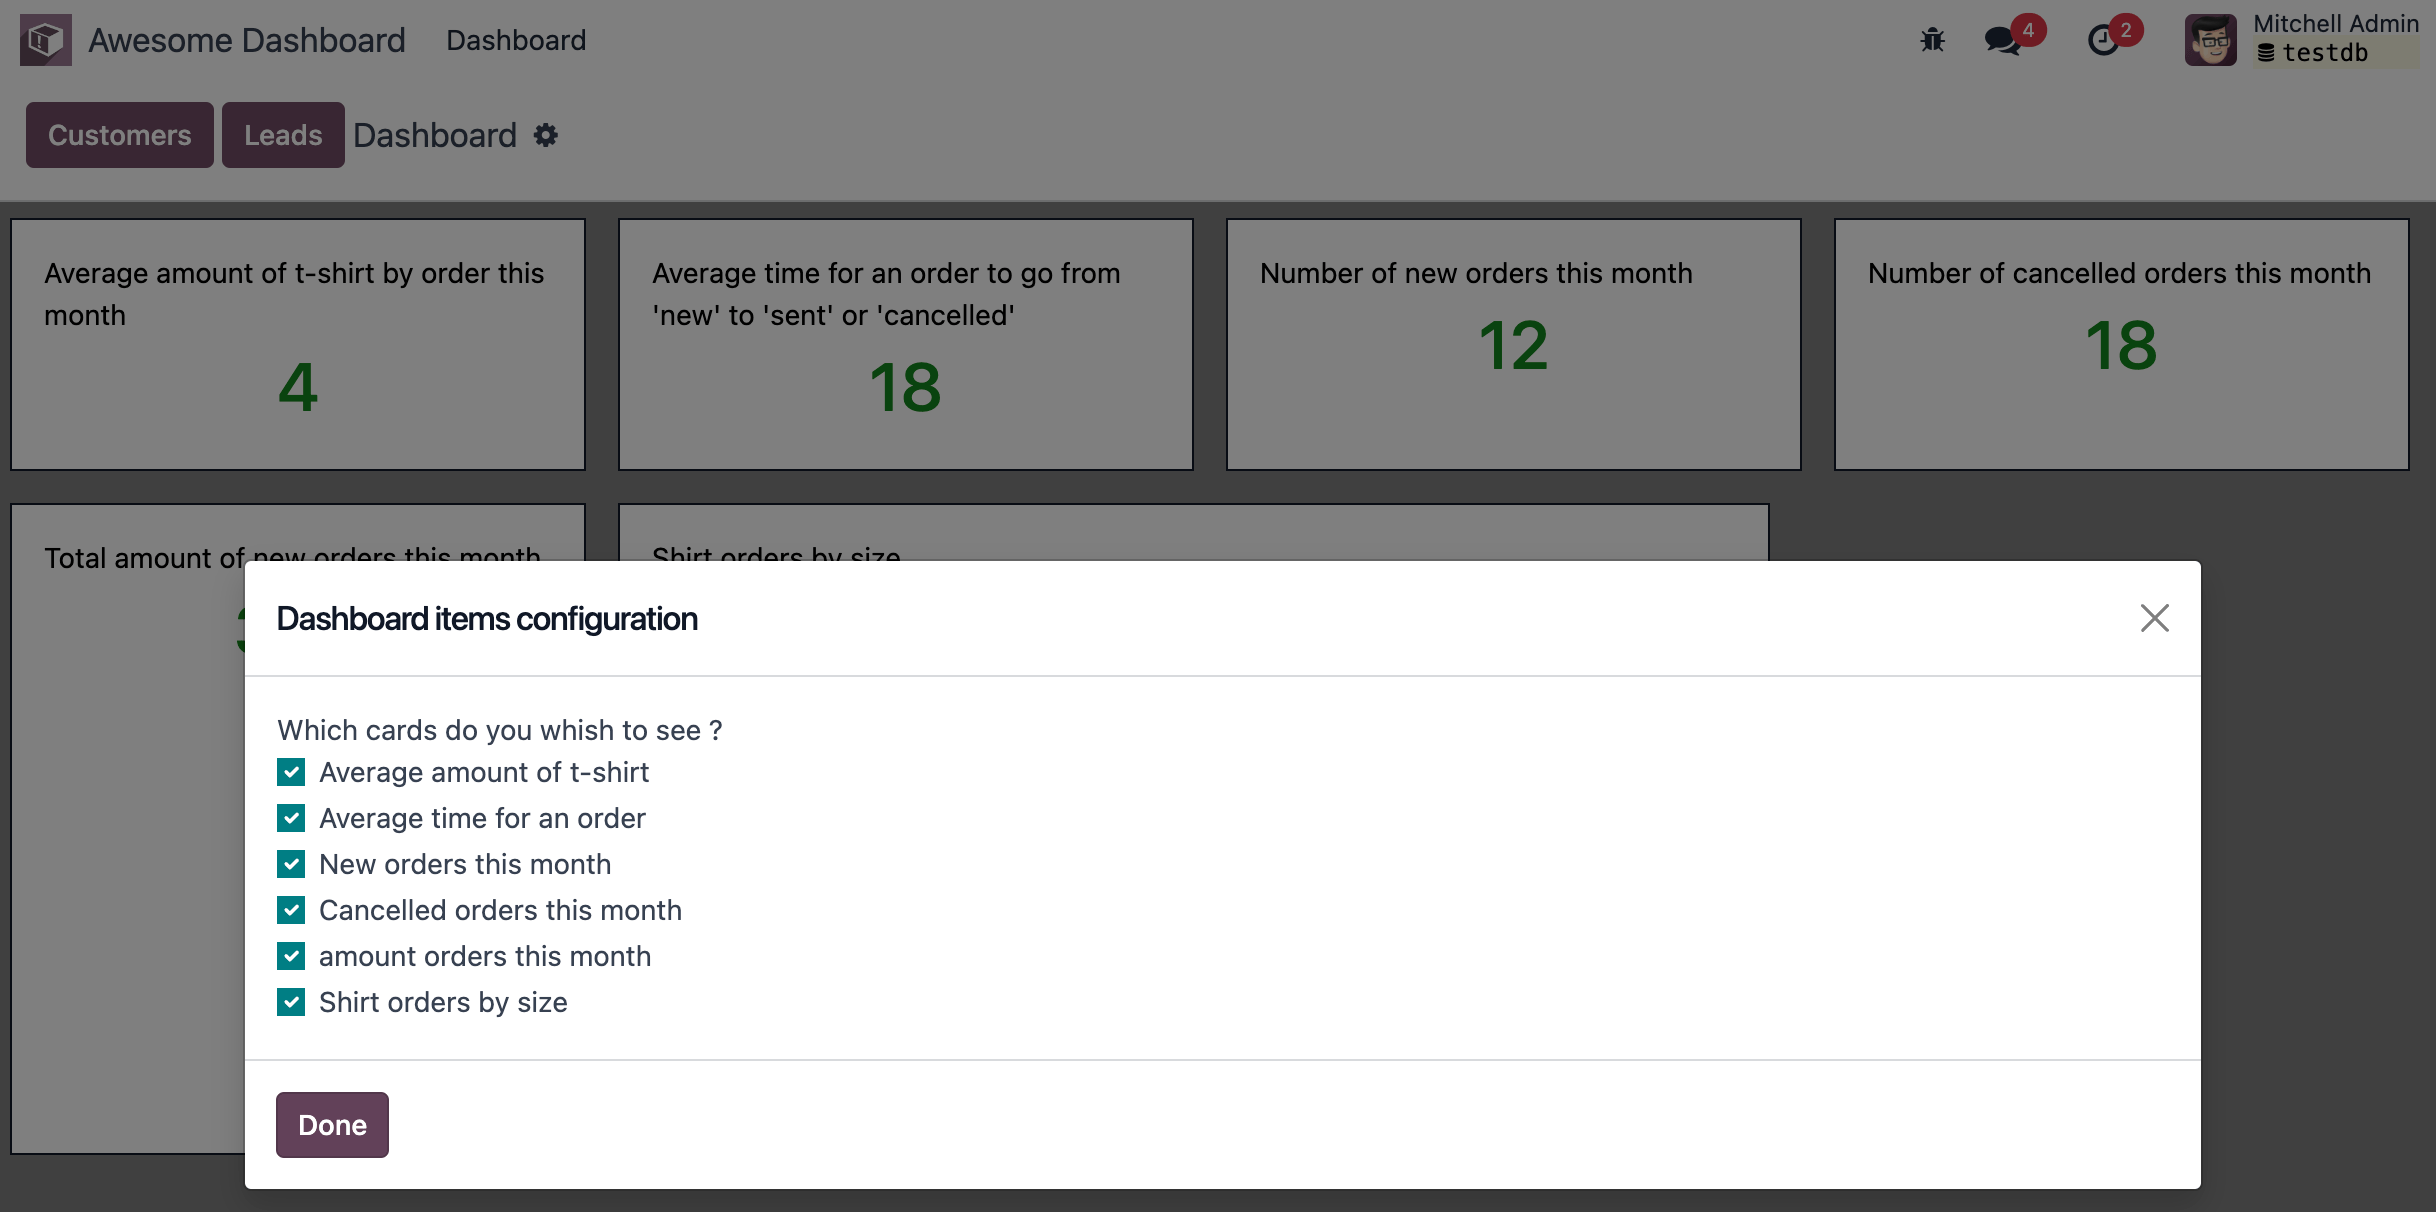
11. Add and remove dashboard items
Let us see how we can make our dashboard customizable. To make it simple, we will save the user dashboard configuration in the local storage so that it is persistent, but we don’t have to deal with the server for now.
The dashboard configuration will be saved as a list of removed item ids.
Add a button in the control panel with a gear icon to indicate that it is a settings button.
Clicking on that button should open a dialog.
In that dialog, we want to see a list of all existing dashboard items, each with a checkbox.
There should be a
Applybutton in the footer. Clicking on it will build a list of all item ids that are unchecked.We want to store that value in the local storage.
And modify the
Dashboardcomponent to filter the current items by removing the ids of items from the configuration.
12. Going further
Here is a list of some small improvements you could try to do if you have the time:
Make sure your application can be translated (with
env._t).Clicking on a section of the pie chart should open a list view of all orders that have the corresponding size.
Save the content of the dashboard in a user setting on the server!
Make it responsive: in mobile mode, each card should take 100% of the width.